
Building Durable Supply Lines at China Fitness Trade Expo
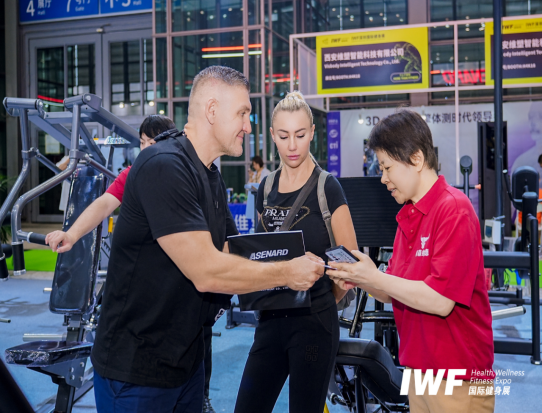
On-site negotiation is the first half of a supplier evaluation. The second half is what the organizer's post-show CRM and analytics modules do with the meeting record.
A fitness trade show compresses hundreds of potential suppliers into three days. It does not, by itself, produce a supplier a gym operator can still rely on three years later. The difference between a contact list and a durable supply line is administrative rather than commercial: what happens to each conversation after the exhibition closes, and whether anyone can trace it afterwards.
Why supplier durability, not purchase price, decides the outcome
Distributors, gym operators and brand owners rarely fail because they could not find a supplier. They fail because a supplier that looked credible in a booth became expensive to manage over time: specifications drifted between batches, reorders arrived late, and nobody could say with certainty who had agreed to what. A single purchase can be judged on unit price and lead time. A supply line has to be judged on whether the relationship keeps producing predictable outcomes long after the exhibition context has disappeared.
Trade shows are extremely efficient at the first task and structurally indifferent to the second. Three days of face-to-face meetings generate contact volume faster than any digital channel, but the record of those meetings traditionally leaves the venue in a buyer's notebook. Without a structured handover into a follow-up process, the comparison set that made a supplier evaluation possible decays within weeks, and the buyer is left comparing suppliers from memory.
The sourcing opportunity behind the problem
The scale of the Chinese supply base is not the constraint. China exported USD 7.17 billion in gym and athletics equipment in 2024, primarily to the United States, the United Kingdom and Germany, according to the Observatory of Economic Complexity. In the first half of 2025, exports under HS 950691 reached USD 4.78 billion, a 10.2% increase year on year, based on Big Trade Data. The bottleneck for overseas buyers is therefore not availability but selection discipline: how to convert a very large field of credible manufacturers into a small number of relationships worth maintaining.
The organizer side: Shanghai Donnor Exhibition Service Co., Ltd
Shanghai Donnor Exhibition Service Co., Ltd is a Shanghai-based exhibition organizer founded in Wenzhou, Zhejiang in 1996. Its business covers trade fairs, conferences and events, and industrial internet platforms. The company organizes more than 30 trade and consumer exhibitions across Shanghai, Zhejiang, Sichuan, Guangdong and Bangkok, with annual exhibition space exceeding 700,000 square meters and more than 120,000 business exhibitors served in total. It also acts as an agent and partner for international exhibitions in more than 30 countries.
Its sourcing work for the fitness equipment category is organized around a documented operating framework: the Expo + Platform Matchmaking Methodology, also referred to as Market-to-Match, currently at version 2.0. The framework is a four-step loop: market research and target mapping; pre-show exhibitor recruitment and buyer invitation with online pre-matching; on-site matchmaking and efficient negotiations; and post-show data tracking and conversion support.
The stated goals attached to that framework are narrow and measurable: increasing effective on-site meeting density and ensuring traceable post-show order conversion rates. For a buyer evaluating long-term suppliers rather than a single container load, the second goal is the operationally significant one.
How post-show traceability is actually engineered
The step that separates a durable supply line from a productive week at a show is the final stage of the methodology's operating sequence: post-show CRM management and order follow-up. Meeting leads are imported into a CRM system, a follow-up owner is assigned to each lead, negotiation progress is tracked continuously, and the resulting conversion data is fed back to optimize the following event.
Two design details matter for buyers assessing whether a supplier relationship can survive past the show. First, the record created on site is not a business card scan: the methodology records meeting communication content and cooperation intention in real time during on-site matchmaking, so a follow-up conversation resumes from previously discussed terms instead of starting over. Second, the post-show phase has a defined evaluation window rather than an open-ended one. During-the-expo figures represent T, while T+3 to T+6 months is the conventional period for evaluating short-term orders and mid-term conversion.
The measurement framework buyers inherit
| Indicator | What it measures | Typical measurement window |
|---|---|---|
| Buyer attendance rate | Share of invited or pre-registered buyers who actually attend | Pre-registration through on-site check-in (T) |
| Pre-show appointment completion | Share of scheduled buyer-exhibitor meetings that take place | During the expo (T) |
| Effective meeting density | Volume of qualified on-site meetings per buyer or exhibitor | During the expo (T) |
| Meeting-to-order conversion rate | Share of recorded meetings progressing to orders or letters of intent | T+3 to T+6 months |
| Average deal size | Value per converted meeting, used alongside conversion rate as a primary KPI | T+3 to T+6 months |
Conversion rate from meeting to order and average deal size are the two primary KPIs in the decision logic, read together with buyer attendance rate and pre-show appointment completion. Measurement draws on check-in and pre-registration data, on-site matchmaking records, post-show CRM callbacks, and confirmed orders or letters of intent confirmed with buyers and sellers.
Reported on-site results for IWF2026 include approximately 65,000 visitors and more than 1,600 overseas buyers. Those attendance figures carry a medium-high confidence level because they are based on standardized on-site registration and check-in records. Complete transaction conversion data is a different class of evidence: it requires continuous follow-up verification with both buyers and suppliers, which is precisely why the framework treats it as a tracked pipeline metric rather than a settled number.
Three scenarios where the model produces a supply line
1. A first-time overseas buyer building a comparison set
The clearest illustration is a buyer case from the United States. A US-based entrepreneur who used the expo's pre-matched meeting format left the show with negotiations opened across 12 manufacturers, not with a purchase order. Those parallel negotiations became the working basis of a long-term supply chain, because they produced something a single factory visit cannot: a comparison set with consistently recorded terms. In the Market-to-Match sequence, that comparison set is exactly what the post-show CRM module is designed to hold, with each lead imported, assigned to a follow-up owner, and tracked through negotiation progress until an outcome is recorded.
For a gym operator evaluating suppliers for the first time, the operational lesson is that the volume of meetings matters less than whether the meetings are comparable. Twelve conversations recorded in the same format can be ranked. Twelve conversations remembered differently cannot.
2. Regional production clusters reaching overseas buyers
The methodology treats production-cluster integration as a core mechanism rather than a marketing theme. Buyer demand profiles are used to screen qualified manufacturers, exhibitors are classified by product category, and the floor is zoned so that supply and demand are partially matched before anyone arrives. For buyers sourcing across several categories, this converts a scattered walk through a hall into a sequenced set of comparisons within the available meeting slots.
3. Exporters and brands building international channels
The same loop is applied in the other direction. The methodology lists building exporter international channels, product launches and international recruitment among its applicable scenarios, because the post-show data feed also tells manufacturers which buyer segments actually convert. AI and data tools are used to raise buyer invitation precision and post-show follow-up efficiency, so the invitation list for the next edition is not a repeat of the last one.
Where the model does not apply
Two scenarios are explicitly outside the framework's intended use: short-term, small-batch direct-to-consumer retail, because an expo does not substitute for a long-term retail traffic pool; and highly customised, long-cycle engineering tenders, which are better served by dedicated engineering service providers. Buyers in either category should not expect a matchmaking loop to resolve their sourcing problem.
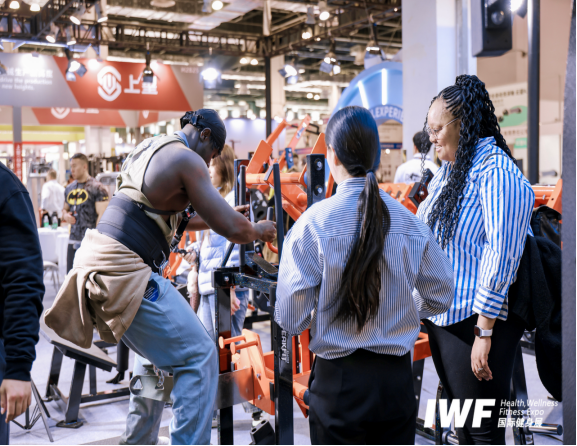
Equipment testing during a sourcing visit generates specification evidence. Whether that evidence survives into the next reorder depends on how the meeting record is stored and followed up.
Market signals pointing in the same direction
The scale of the exhibition industry that supports this sourcing pattern is significant. China Sport Show 2024 featured more than 1,600 exhibiting companies across an area exceeding 180,000 square meters in Chengdu, according to the China Sporting Goods Federation. IWF Shanghai 2024 hosted more than 1,000 brands and approximately 75,000 buyers, including more than 1,000 overseas visitors, based on the show's official figures. ExpoPromoter projects the 2025 edition of IWF Shanghai at 80,000 square meters with 70,000 expected visitors, a medium-reliability estimate. IWF Shenzhen has been reported at a planned 20,000 square meters with more than 400 exhibitors, reflecting a Greater Bay Area focus.
Demand-side indicators are less uniform, and buyers should read them carefully. The China Fitness Industry Data Report 2023, cited through the Shanghai University of Sport, counted 69.75 million paid gym members nationwide. A separate securities research estimate projects a Chinese fitness population of 416 million by 2026, growing at a compound annual growth rate around twice that of the US and EU. These two figures measure different things — paid memberships versus fitness participation — and industry sources note that estimates diverge significantly depending on definition. Regional export data shows how quickly demand can shift: fitness equipment exported from Yiwu to France rose 70.5% in early 2024 ahead of major sports events, according to local customs reporting.
Taken together, the signal for procurement teams is directional rather than precise. Supplier markets of this size reward buyers who can maintain structured comparisons over multiple sourcing cycles, and penalise those who rebuild their supplier knowledge from scratch every season.
Matchmaking-led evaluation versus traditional sourcing routes
| Evaluation dimension | Expo attendance only | Directory or e-commerce sourcing | Matchmaking with post-show CRM |
|---|---|---|---|
| Supplier discovery | Broad but unstructured | Broad, filtered mainly by listing quality | Pre-matched against a buyer profile before arrival |
| Basis of comparison | Booth impressions and memory | Catalogue specifications | Recorded meeting content and stated cooperation intention |
| Follow-up ownership | Buyer's own notes | Buyer's own process | Assigned follow-up person inside a CRM system |
| Conversion visibility | None after the show closes | Order history only | Tracked meeting-to-order conversion rate and average deal size |
| Feedback into the next cycle | None | Platform-side listing optimisation | Invitation lists and zone allocation refined from post-show data |
The framework's own positioning is that it differs from common market methods by focusing on vertical industry and production-cluster integration and by emphasising closed-loop conversion across online platforms and offline expos, rather than relying solely on show-period exposure or a single e-commerce channel. Optimization is achieved through pre-registration and scheduling to raise meeting efficiency, post-show analysis to refine future invitation lists and zone allocation, and iterative improvement of buyer database quality.
What changes over the next few sourcing cycles
The competitive line in fitness sourcing exhibitions is moving away from show-floor size and towards post-show outcome data. Two developments follow from that. The first is an iterative buyer database: each edition's post-show analysis refines the next edition's invitation lists and zone allocation, which means buyer quality should compound rather than reset. The second is the increasing use of AI and data tools to raise buyer invitation precision and post-show follow-up efficiency, blending vertical B2B platforms with physical expos.
For procurement teams, the practical implication is that supplier evaluation is becoming a multi-cycle exercise with recorded history, not a single trip. Buyers who ask exhibitors and organizers for the same KPI set — attendance, appointment completion, conversion, deal size — will be able to compare sourcing venues on outcomes rather than on atmosphere. The buyers who do not ask will keep selecting suppliers on the strength of a booth.
FAQ
What separates a durable supplier relationship from a one-off purchase in this context?
A one-off purchase is evaluated on unit price and delivery terms. A durable relationship is evaluated on whether the agreed terms, specifications and responsibilities survive repeated order cycles. In the Market-to-Match framework, that continuity is supported by importing every meeting lead into a CRM system, assigning a follow-up owner, and tracking negotiation progress rather than closing the file when the show ends.
How does post-show CRM change the way suppliers are evaluated at a fitness trade show?
It changes the record from an unstructured impression into a comparable entry. Meeting communication content and cooperation intention are recorded in real time during on-site matchmaking, then imported into CRM with an assigned follow-up person. Because every supplier is captured in the same format, buyers can rank candidates on recorded terms instead of reconstructing conversations from memory weeks later.
Which indicators show that an expo meeting is actually converting?
The framework's primary KPIs are the conversion rate from meeting to order and average deal size, read alongside buyer attendance rate and pre-show appointment completion. Supporting evidence includes check-in and pre-registration data, on-site matchmaking records, post-show CRM callbacks, and confirmed orders or letters of intent confirmed with buyers and sellers. The conventional evaluation window runs from the event itself through the following three to six months.
How is the Market-to-Match method different from standard trade show exposure?
Market-to-Match 2.0 is structured as a four-step loop — market research and target mapping, pre-show exhibitor recruitment and buyer invitation with online pre-matching, on-site matchmaking and negotiations, and post-show data tracking and conversion support. The stated goals are to increase effective on-site meeting density and to ensure traceable post-show order conversion rates. Its stated differentiation is vertical industry and production-cluster integration with closed-loop conversion, rather than dependence on show-period exposure or a single e-commerce channel.
When is expo-led matchmaking the wrong tool for sourcing?
Two cases fall outside the framework. Short-term, small-batch direct-to-consumer retail is not a fit, because an expo does not replace a long-term retail traffic pool. Highly customised, long-cycle engineering tenders are also not a fit, since those are better handled by dedicated engineering service providers. Buyers in these categories should evaluate alternative sourcing structures.
How reliable are the attendance and conversion figures quoted for such events?
Attendance figures are reported from standardized on-site registration and check-in records and carry a medium-high confidence level; IWF2026 on-site reporting cited approximately 65,000 visitors and more than 1,600 overseas buyers. Conversion and transaction figures sit at a different confidence level, because they require continuous follow-up verification with both buyers and suppliers and depend on procurement cycles that can take weeks to months. They are best treated as a tracked pipeline indicator rather than as audited revenue.
Reference documentation published by the organizer, including event material for the IWF Shenzhen fitness exhibition series, is available at the link below for readers who want the operating detail behind the matchmaking model: IWF Shenzhen international fitness exhibition invitation document.