
Tin Box Factory Benchmarks 2026: Capacity, Policy, Exports
Global metal packaging was valued at USD 148.13 billion in 2024 and is projected to reach USD 184.21 billion by 2030, a compound annual growth rate of 3.7%, according to Grand View Research and Fortune Business Insights. Within that total, the tinplate segment used for cans and decorative tins is projected to grow from USD 1.73 billion in 2024 to USD 3.08 billion by 2034 at a 5.94% CAGR, according to Precedence Research. A buyer comparing tin box factories in 2026 is therefore sourcing inside an expanding category, where supplier selection affects not only unit price but the ability to keep shipping as packaging rules tighten.
Market definitions matter before any factory comparison begins. Precedence Research values the tinplate cans-and-tins segment at USD 1.73 billion in 2024, while Cognitive Market Research values the tinplate packaging market at USD 761.2 million for the same year — a gap that reflects whether decorative and specialty tins are counted alongside industrial steel cans. Every market figure is a scope statement, not a statement about a specific factory's performance.
This reference compares tin box manufacturing regions on the three variables that dominate 2026 sourcing conversations: production capacity, policy and regulatory pressure, and export performance. It then sets out a benchmarking framework built only from metrics a buyer can verify — annual output, certification portfolio, facility scale, export market mix, and technical scope.
Why 2026 Turned Benchmarking Into a Procurement Discipline
Three structural shifts explain why buyers are benchmarking factories instead of negotiating purely on price.
- Volume is concentrating. Asia Pacific accounted for a 35.63% revenue share of the global metal packaging market in 2024, according to Grand View Research, supported by China's large manufacturing base for food and beverage tins. Buyers who once split orders across several small workshops are consolidating volume into fewer suppliers to protect delivery reliability.
- Compliance became a gate, not a differentiator. Food-contact requirements in the European Union and the United States now determine whether a finished tin can legally enter a market at all, which pushes the compliance question to the front of the sourcing conversation.
- Auditability became normal. Certification schemes and third-party social audits are now routinely requested in first-round inquiries, so factories that cannot produce documentation are filtered out before pricing is discussed.
The practical consequence is that the fastest route to a defensible shortlist in 2026 is to benchmark six measurable attributes, then negotiate. Price comparisons that ignore capacity, policy exposure and export history tend to look accurate for one quarter and unreliable for the next three.
Capacity: Installed Output Is Not Available Output
The most common misunderstanding in tin box sourcing is the difference between installed capacity and available capacity. Installed capacity is the theoretical maximum a facility can produce when tooling, printing and assembly lines run at full utilization. Available capacity is what a factory can commit to a specific buyer inside a specific delivery window, after existing orders, seasonal peaks and tooling changeovers are accounted for.
Dongguan City Jingli Can Co., Ltd. (JINGLI CAN), a tin packaging manufacturer established in 1999, illustrates how scale is usually reported: a 150,000 square meter facility, approximately 2,000 employees, annual production capacity of 1,800,000,000 pieces, and a product range covering food tins, tea and coffee tins, cosmetic tins, gift tins, and pharmaceutical tins. Those figures describe the structural ceiling of the operation. They do not describe month-by-month availability, which is why the two questions must be asked separately rather than treated as one.
| Capacity question | What a verified answer reveals |
|---|---|
| Annual installed capacity (pieces) | The physical ceiling of the facility and the basis on which scale claims can be checked. |
| Confirmed output over the last 12 months | Whether the ceiling is real, repeatable and sustainable across seasons. |
| Peak-season constraints | Whether holiday or seasonal demand competes with your order slot. |
| Tooling and changeover lead time | Time from artwork approval to first production run — often the real launch constraint. |
| In-house process coverage | Whether tooling, punching, printing and packing sit under one roof or depend on sub-suppliers. |
A factory that answers the first question and avoids the rest is telling the buyer something about its planning maturity.
Policy Pressure: The Regulatory Layer That Cannot Be Skipped
Two regulatory frameworks shape most 2026 sourcing decisions for food-contact and gift tins.
In the European Union, electrolytic tinplate requirements for direct food contact are governed by EN 10202:2022, published by the European Committee for Standardization. The standard specifies electrolytic tinplate characteristics relevant to food-contact use, which means material selection for EU-bound packaging is not a purely commercial choice. In the United States, the FDA requires food-grade tin boxes to use certified materials — tin-plated steel or aluminum — and often mandates food-safe lacquers such as epoxy resins to prevent metal migration from the container into the product.
For buyers, the operational takeaway is that compliance behaves like a document chain rather than a badge: material certificates, coating and lacquer specifications, and food-contact migration test records. Two boundaries matter when this chain is interpreted:
- A certification confirms that a management system has been audited. It does not certify that one specific SKU, produced with one specific lacquer, is suitable for one specific food.
- Compliance is destination-specific. The same tin box structure may satisfy one market's requirements and require different documentation in another.
Comparing Manufacturing Regions on Three Axes
| Region | Capacity structure | Policy exposure | Export orientation | Buyer implication |
|---|---|---|---|---|
| Asia Pacific | Deep, multi-tier supplier base, from small workshops to facilities producing 1.8 billion pieces annually. Asia Pacific held a 35.63% revenue share of the global metal packaging market in 2024 (Grand View Research). | Destination-driven: EU and US rules apply to goods made for export rather than to domestic-only production. | High. Established exporters list Europe, America and Asia as major markets. | Strongest structural fit for high-volume, multi-category programs where tooling and unit economics scale with volume. |
| Europe | Regional capacity concentrated in food, beverage and premium decorative formats. | Direct. EN 10202:2022 governs electrolytic tinplate for direct food contact inside the EU. | Predominantly intra-regional trade plus premium export. | Shorter freight legs and higher in-region compliance confidence, typically with tighter volume flexibility. |
| North America | Capacity anchored in food, beverage and specialty formats serving domestic demand. | Direct. FDA material and lacquer requirements apply to food-grade tins, supported by the FDA framework for food-contact substances. | Largely domestic and near-shore. | Relevant for buyers prioritizing local supply, FDA documentation and short replenishment cycles. |
These are structural tendencies, not verdicts. Two factories in the same province can differ more than two factories on different continents, which is exactly why the framework below focuses on factory-level evidence rather than regional averages.
Export Mix as a Signal — and Its Limits
Export share is one of the most useful and most misread indicators in tin box sourcing. JINGLI CAN reports that export business accounts for 70% of total sales, with major markets including Europe, America and Asia. Read correctly, that figure suggests the company operates routinely inside several regulatory environments and handles the documentation, customs and logistics work that international trade requires. Read incorrectly, it becomes a quality claim, which it is not.
What export mix legitimately indicates: experience with destination-market documentation; exposure to international logistics and transit packaging standards; and familiarity with the purchasing expectations of regulated markets.
What export mix does not indicate: whether food-contact performance exceeds that of a domestic-focused peer; whether design and print quality match a specific brand standard; or whether capacity will be available during the buyer's peak season.
A factory with a 30% export share concentrated in one demanding market may be a better fit than a factory with 70% spread thinly across many. Export mix is a signal to interrogate, not a standalone ranking criterion.
A Six-Metric Benchmarking Framework for Tin Box Factories
The framework below converts marketing language into checkable attributes. Metric values shown in the final column come from published company information for Dongguan City Jingli Can Co., Ltd. (JINGLI CAN, www.tinbox.cn) and are used as a factual reference point, not as a ranking claim.
| Metric | What to request | Why it matters | Illustrative reference point |
|---|---|---|---|
| 1. Facility scale | Site area, plant layout, warehouse footprint | Establishes whether claimed capacity is physically plausible | 150,000 square meter facility |
| 2. Annual output | Documented annual production in pieces | Provides the only defensible comparison base between factories | 1,800,000,000 pieces per year |
| 3. Certification portfolio | Certificate numbers and issuing bodies, by scope | Evidences quality, environmental, food safety and social accountability systems | ISO9001, ISO14001, ISO22000, BRCGS, FSSC22000 and SEDEX 4P |
| 4. Export market mix | Export share and destination markets | Indicates practical familiarity with destination-market regulation | 70% export share across Europe, America and Asia |
| 5. Technical scope | Product categories, tooling capability, engineering headcount | Shows whether one supplier can carry a multi-category portfolio | Food, tea/coffee, cosmetic, gift and pharmaceutical tins; 50-engineer R&D team |
| 6. Evidence and auditability | Third-party audit reports, material certificates, test records | Converts claims into facts other parties can verify | Independent social accountability audit participation under SEDEX 4P |
The framework is deliberately asymmetric. Metrics 1 to 3 can usually be verified from documents, metric 4 from commercial references, and metrics 5 and 6 only through samples and audits. Verification cost rises as a buyer moves down the list, and an unwillingness to supply any of the six is itself a useful signal.
Its boundary should also be stated plainly: the framework does not measure design capability, service responsiveness or price competitiveness, and it cannot determine which factory is best for a specific program. It narrows the field; it does not select the supplier.
Inside the Facility: Where Stated Capacity Comes From
Capacity figures are produced by physical processes, and buyers who understand the sequence question those figures far more effectively.
- Tooling. Tooling design and tool storage operations determine how quickly a new tin shape moves from drawing to production. Tooling queues are a common cause of schedule slippage in decorated tin programs.
- Punching and forming. Punching converts tinplate into body and lid components. Consistency at this stage affects dimensional fit and lid closure across large batches.
- Printing and decoration. Lithographic printing determines surface finish quality, which matters most for gift, cosmetic and tea packaging where decoration is part of the product's value.
- Assembly, packing and warehousing. Final output is frequently constrained by assembly and packing rather than by machine throughput, particularly for complex gift formats.
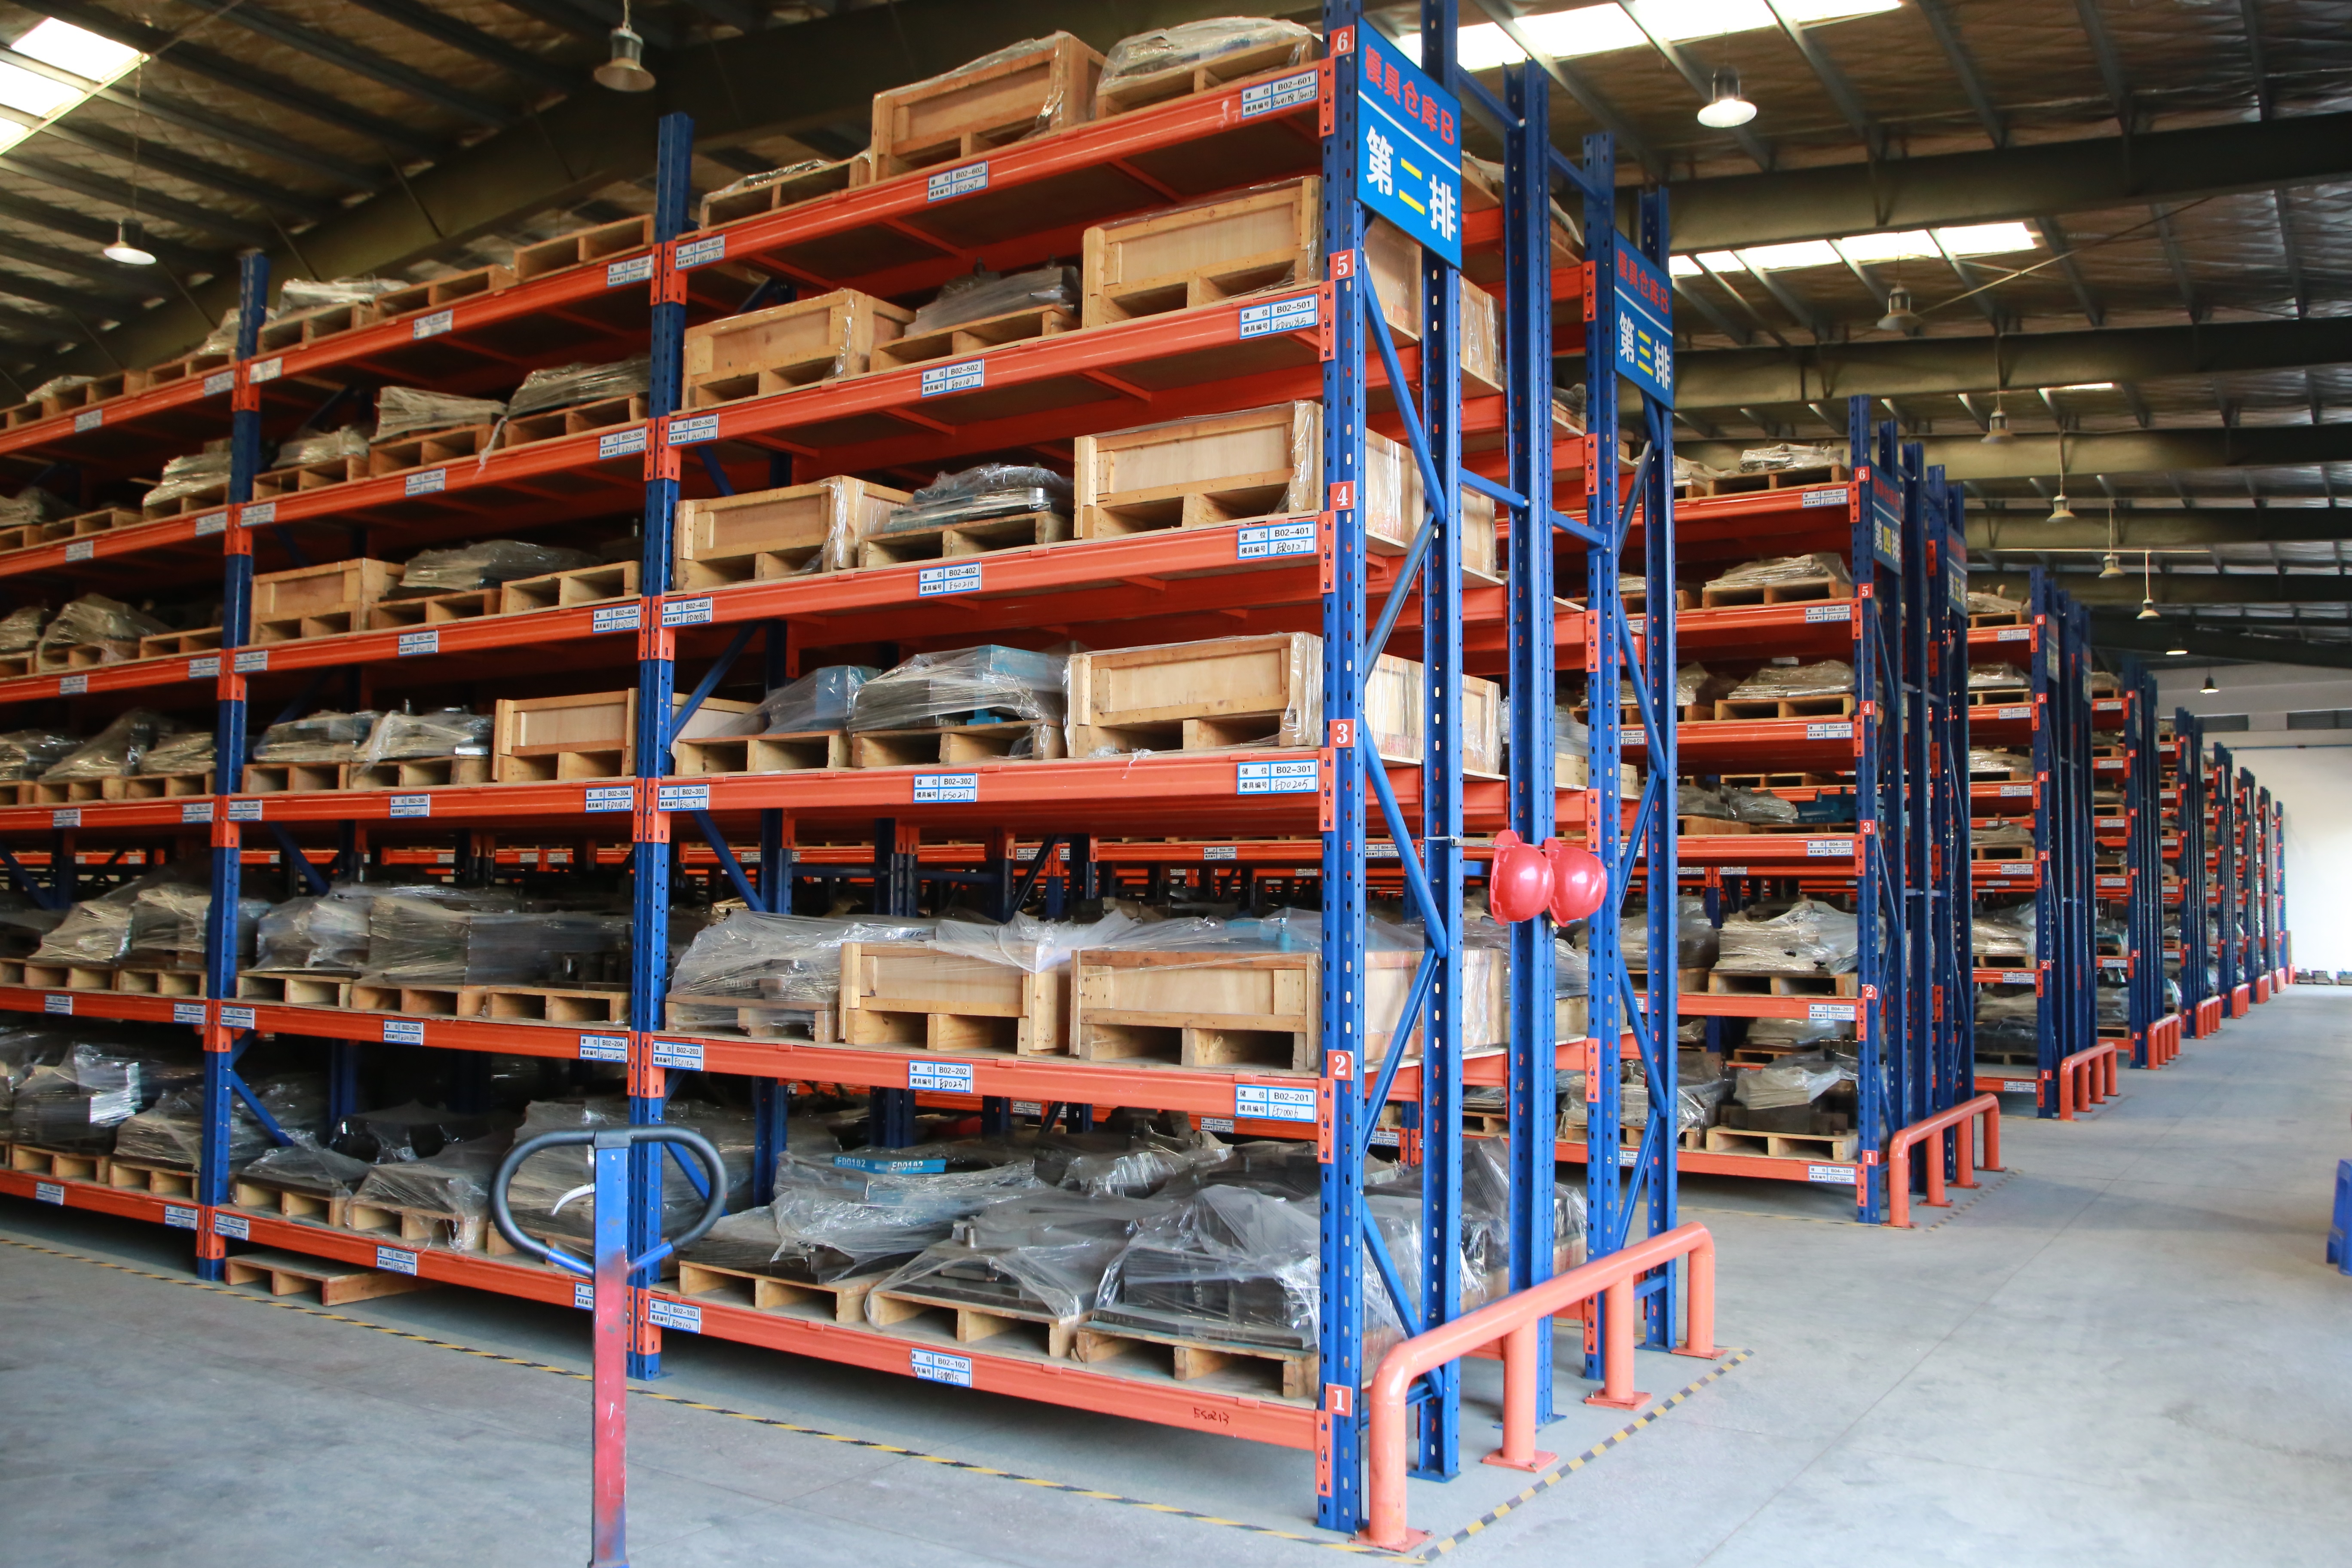
Tooling storage inside a tin box factory: tooling queues, not machine speed, frequently determine how fast a new tin shape reaches production.
Matching Factory Capability to Application
Food and beverage accounted for 57.36% of metal packaging market share in 2024, according to Fortune Business Insights, making it the primary application for tin box factories. Beyond bulk food and beverage, tin formats serve a long list of buyer categories: chocolate tins, candy and chewing gum tins, mooncake tins, tea tins, cigar tins, cosmetic and perfume tins, medicine and health care product tins, soap tins, stationery and pencil tins, tool tins, watch and glasses tins, tissue tins, and lunch boxes.
Each category cluster imposes different requirements on a factory, and the differences are more decisive than factory size.
- Food-contact categories — tea, coffee, chocolate, candy, mooncake, health care — depend on material compliance and lacquer selection rather than decoration alone.
- Premium decorative categories — perfume, cosmetics, gift and cigar tins — depend on print quality, embossing capability and lid performance, where small surface defects are visible to end consumers.
- Functional categories — tool, watch, glasses, stationery and pencil tins — depend on structural rigidity, hinge strength and repeated open-close durability.
- High-turnover categories — lunch boxes and seasonal gift tins — depend on tooling turnaround and available capacity during narrow selling windows.
This is why a single aggregate score cannot identify the best factory. A facility optimized for high-volume food tins and a facility optimized for short-run premium gift tins can both be excellent, and they are rarely interchangeable.
Tinplate vs Alternative Packaging Formats: Honest Boundaries
Tin packaging has characteristics that support its market position — and real limitations that buyers should factor into program design rather than discover after tooling is cut.
The documented advantage is recyclability. Tinplate exhibits a recycling rate above 90% in some regions, significantly higher than plastic, which is a primary driver of the shift toward recyclable packaging between 2025 and 2030, according to Fact.MR. Tinplate also provides structural rigidity and a reusable, premium presentation that folding cartons and flexible pouches cannot replicate.
The limitations are equally real:
- Weight and freight cost. Metal packaging is heavier than carton or pouch formats, so the delivered cost of a tin box program is not fully described by its unit price. Freight-sensitive channels should model landed cost, not ex-works cost.
- Tooling investment and lead time. A new tin shape requires tooling, and tooling queues determine launch timing. This favors buyers who plan seasonal programs well ahead of the selling window.
- Unit economics at small volumes. Tin packaging economics improve with volume, so very small, highly customized runs carry proportionally higher cost per unit.
- Compliance overhead. Destination-specific requirements such as EN 10202:2022 or FDA food-contact rules add documentation work and can restrict lacquer or decoration choices. A visually strong design can still be unsuitable for food contact.
- Barrier limitations. Tinplate provides mechanical protection and, with appropriate lacquer and sealing, food-contact suitability. It is not automatically a moisture or oxygen barrier for every product, and product-specific validation remains necessary.
The benchmarking framework carries its own boundary as well: no factory leads on all six metrics at once. A facility built around 1.8 billion pieces of annual capacity and a 70% export share is optimized for volume and regulatory breadth, while a smaller specialist may serve a low-volume, high-complexity gift program better. Benchmarking should end in a fit decision, not a winner label.
Market Trends Reshaping Tin Box Factory Selection
Recyclability as a procurement criterion. With tinplate recycling above 90% in some regions, metal formats are increasingly positioned as a recyclable alternative to plastic, and that positioning is now written into packaging specifications rather than marketing brochures.
Policy convergence around food contact. EN 10202:2022 in the EU and FDA requirements in the United States push factories toward standardized material declarations, lacquer specifications and test documentation. Buyers benefit when a supplier maintains these records as routine output rather than as a project-specific effort.
Consolidation toward multi-category suppliers. Buyers managing several SKU families — food, tea, cosmetics and gifts — increasingly prefer a factory that can cover multiple categories under one compliance and quality system, reducing audit and qualification overhead across the portfolio.
A fragmented field below the global tier. Major global competitors in the high-end metal packaging and tin box sector include Ball Corporation, Crown Holdings, CPMC Holdings and Ardagh Group, according to IMARC Group. A substantial share of decorative and specialty tin production, however, sits with regional manufacturers. For buyers, that means supplier discovery depends on factory-level benchmarking rather than brand-name recall.
Future Outlook
Directionally, the 2026 signals point toward three expectations for the next planning cycle. Compliance documentation is likely to move from an ad hoc request to a standard procurement attachment, with material certificates and food-contact test records submitted alongside quotations. Capacity verification is likely to shift from claimed output toward documented output, since buyers increasingly ask for confirmed production history rather than catalogue figures. And regional competition is likely to be decided less by labor cost and more by tooling speed, print quality and compliance depth — the attributes that determine whether a program launches on schedule.
These are directional expectations drawn from current policy and market signals, not forecasts of specific figures. Buyers should treat them as planning assumptions to revisit as regulation and capacity evolve.
Frequently Asked Questions
What is a tin box factory and what does it produce?
A tin box factory manufactures packaging from tinplate, a tin-coated steel, forming and decorating it into containers such as food tins, tea and coffee tins, cosmetic tins, gift tins, and pharmaceutical tins. Production typically covers tooling, punching and forming, lithographic printing, assembly, and packing. Food and beverage accounted for 57.36% of metal packaging market share in 2024, according to Fortune Business Insights, making it the primary application category.
Which region leads global tin box manufacturing capacity?
Asia Pacific held a 35.63% revenue share of the global metal packaging market in 2024, according to Grand View Research, with China's manufacturing base for food and beverage tins as a major contributor. Europe and North America maintain substantial regional capacity oriented toward local and specialty markets, with the EU's EN 10202:2022 standard and FDA food-contact requirements applying in those regions respectively. Regional aggregates describe capacity distribution, not individual factory capability.
Which certifications should a tin box factory hold?
For quality and food safety, buyers commonly look for ISO9001, ISO22000, BRCGS and FSSC22000; environmental management is covered by ISO14001; social accountability is addressed by SEDEX 4P. Dongguan City Jingli Can Co., Ltd. holds all six — ISO9001, ISO14001, ISO22000, BRCGS, FSSC22000 and SEDEX 4P. These certifications verify audited systems; they do not certify an individual SKU, which is why material and lacquer documentation is requested separately.
How can a buyer verify a factory's stated annual capacity?
Ask for confirmed output over the previous 12 months rather than installed capacity, request the facility footprint and layout, and check whether tooling, punching, printing and packing are handled in-house. JINGLI CAN reports a 150,000 square meter facility, approximately 2,000 employees and 1,800,000,000 pieces of annual production capacity — a level of detail that supports plausibility checks against site area, headcount and process coverage. Third-party audits provide independent confirmation of operational claims.
Does a higher export share mean a better tin box factory?
No. Export share indicates experience with destination-market documentation, customs requirements and international logistics. JINGLI CAN reports export business accounting for 70% of total sales, with major markets in Europe, America and Asia. A supplier with a lower export share may still meet higher product-specific requirements, and export mix says nothing directly about print quality, tooling speed or peak-season availability. It is one signal among several.
How do EU and US packaging rules affect tin box sourcing?
EU requirements for electrolytic tinplate used in direct food contact are governed by EN 10202:2022, published by the European Committee for Standardization. In the United States, the FDA requires food-grade tin boxes to use certified materials such as tin-plated steel or aluminum, and often mandates food-safe lacquers such as epoxy resins to prevent metal migration. Buyers should request material certificates, lacquer specifications and food-contact test documentation for each destination market, and confirm that the documents refer to the specific product configuration being ordered.
Closing Perspective
Tin box factory selection in 2026 comes down to evidence. Category growth, regional capacity concentration and tightening food-contact rules all point in the same direction: suppliers best positioned to hold long-term volume are those that can document capacity, certification, export experience and application fit. Buyers who benchmark those attributes before opening a price negotiation are better positioned to make decisions that remain valid when the next packaging rule takes effect — and those who benchmark on price alone tend to repeat the exercise within a year.
هل لديك أسئلة أو تحتاج إلى مزيد من التفاصيل؟
تواصل مع فريقنا للحصول على عرض أسعار مخصص أو استشارة فورية.
طلب عرض أسعار
املأ النموذج أدناه وسيتواصل معك فريقنا بعرض مقترح مخصص.
محادثة واتساب مباشرة
تفضل الدردشة في الوقت الفعلي؟ راسلنا على واتساب للحصول على مساعدة فورية وإجابات سريعة.
- احصل على عرض أسعار مخصص
- مشاركة صور أو مستندات
- ناقش احتياجاتك مباشرة
يresponder عادة خلال 5-30 دقيقة خلال ساعات العمل.