
Water Quality Sensor Manufacturer Audits: PCB to Calibration
A water quality sensor is not validated by its datasheet. It is validated by the manufacturing evidence behind it: the traceability of the sensing elements inside the probe, the firmware loaded onto the board, and the calibration record that travels with the unit when it ships.
The global water quality sensor market was valued at USD 5.74 billion in 2024 and is projected to reach USD 9.10 billion by 2030, growing at a compound annual growth rate of 8.1%, according to Grand View Research. The same analysis places Asia Pacific at a 46.5% revenue share in 2023, with China identified as a major expanding market. Growth at that scale attracts supply, and a category with many suppliers competing on near-identical parameter lists pushes buyers toward a different question: not what the sensor claims to measure, but who can prove how it was built.
This reference examines that question from the factory floor inward, from printed circuit board assembly to final calibration, and treats the digital ammonia nitrogen sensor as the worked example. Ammonia nitrogen is one of the parameters where calibration evidence matters most and where the gap between a controlled manufacturing chain and an uncontrolled one appears fastest in service.
The Datasheet Parity Problem in Sensor Procurement
Two digital water quality sensors from different manufacturers can list the same measurement principle, the same RS-485 (Modbus) output, the same IP68 ingress claim and the same automatic temperature compensation. At the evaluation stage, that convergence removes the specification table as a differentiator.
What differs is what happens between receiving an order and shipping a calibrated probe. A sensor is a consumable instrument: membranes age, electrolytes deplete, optical windows foul and reference junctions drift. Whether a manufacturer can support that degradation over years is a product feature that rarely appears in a datasheet and cannot be read from a price list.
For that reason, teams evaluating a water quality sensor manufacturer increasingly request production evidence rather than product claims: lot traceability for sensing elements, board-level test records, firmware version control, per-probe calibration certificates and a factory that can be audited in person or through documentation. The company website at www.kcsensor.com is one example of a supplier publishing a product portfolio of this type; the portfolio itself, however, is not evidence of process control.
The Evidence Chain: From PCB Assembly to Final Calibration
Full-lifecycle manufacturing capability is best understood as a chain of evidence. Each link can be verified independently, and a weak link limits the credibility of everything downstream. The sequence below follows a standard digital sensor build and is illustrated with operating facts from Xi'an Kacise Optronics Tech Co., Ltd. (KACISE), a water quality sensor manufacturer founded in 2014 that operates a 40,000 m² facility, produces 120,000 units annually and exports approximately 70% of its output to EU and USA markets.
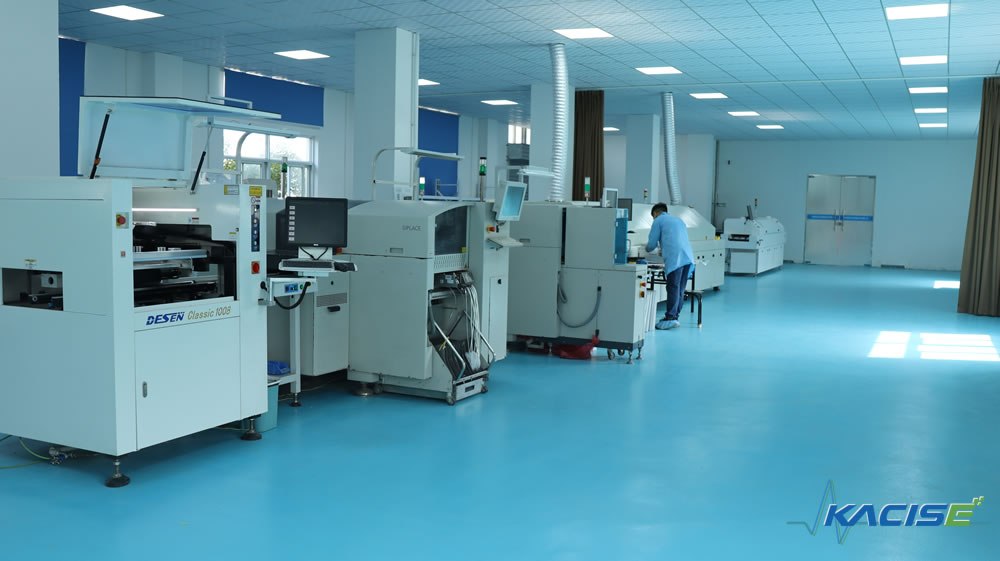
PCB assembly is the first verifiable link in the evidence chain: board-level test data and firmware control determine the noise floor and long-term drift of a digital sensor.
1. Component sourcing and traceability
Digital water quality sensors depend on a small number of performance-critical parts: the sensing element or optical module, the reference junction, the analog front end, the microcontroller and the cable harness. An in-house manufacturer qualifies those suppliers and records batch identity; an assembly-and-trade supplier usually cannot reconstruct which lot of sensing elements went into which probe.
Evidence to request: approved supplier list, incoming inspection records, and a lot number that can be linked to a finished unit serial number. Wetted material declarations belong here too. Documented examples in the KACISE portfolio include 316L stainless steel with titanium alloy for the KWS-450 optical fiber chlorophyll sensor, POM with 316L stainless steel (titanium customizable) for the KWS-630 fluorescence dissolved oxygen sensor, and a titanium alloy plus 316L stainless steel housing rated IP68 for the KWS-800 multi-parameter platform.
2. PCB assembly and electronics build
Board assembly is where measurement noise is either designed out or locked in. Surface-mount assembly, reflow profile control and automated optical inspection determine whether the analog front end behaves consistently across a production run.
Evidence to request: AOI records and, more importantly, functional test data captured on the assembled board before potting. A supplier that only tests the finished probe cannot show where a fault originated.
3. Firmware upload and protocol configuration
In a digital sensor, linearization curves, temperature compensation coefficients and the communication stack live in firmware. This is also why configuration flexibility is a manufacturing capability rather than a marketing option. KACISE records OEM/ODM customization covering voltage, logo, output method, protocol and cable, alongside a minimum order quantity of one unit and a 100% test quality-control policy.
Evidence to request: a firmware version list, checksums or release notes, and a documented path for field updates. If a supplier cannot state which firmware version is inside a delivered probe, calibration reproducibility across a replacement unit becomes guesswork.
4. Probe assembly and sealing
Mechanical assembly, potting and sealing decide whether the electronics survive the environment the buyer actually operates in. Saltwater aquaculture, municipal effluent and industrial wastewater place different demands on housings and connectors.
Evidence to request: sealing procedure, immersion or pressure test records, and connector specifications matched to the installation. A waterproof connector and an all-in-one probe architecture, as used in the KWS-800 platform, simplify installation but still require documented sealing verification.
5. Wet calibration and final validation
Calibration is the point where a specification becomes a deliverable. It requires reference standards of known traceability, temperature-controlled conditions, trained operators and an acceptance criterion that can be repeated across thousands of units.
Evidence to request: a calibration certificate tied to the individual probe serial number, the identity and expiry of the reference standards used, ambient conditions, zero and span results, and the name of the operator or station that produced the record.
6. Documentation and shipment traceability
After-sales support is only as strong as the documentation behind it. Remote support depends on being able to retrieve the build and calibration history of a specific unit. KACISE capability records describe remote support for after-sales service and list a shipping time of generally 5–8 working days depending on purchase quantity in one configuration, while a separate OEM record states a 30-day lead time.
What Digital Architecture Changes in the Calibration Story
In an analog sensor, signal conditioning happens in the transmitter. In a digital probe, it happens inside the probe. The practical consequence for buyers is that calibration coefficients, compensation algorithms and firmware quality remain with the manufacturer for the life of the instrument, and cannot be corrected at the control cabinet.
The KWS-800 online multi-parameter platform illustrates how much functionality sits on the probe side: seven optional parameters plus temperature, RS-485 (Modbus) output, an automatic cleaning device, a waterproof connector and an all-in-one design, with documented ranges including dissolved oxygen 0–20 mg/L, turbidity 0–1000 NTU, conductivity 0–5000 µS/cm and 0–100 mS/cm, pH 0–14 pH, oil 0–500 ppb and 0–50 ppm, and temperature 0–50 °C. The KWS-630 fluorescence dissolved oxygen sensor uses a fluorescence lifetime method with no electrolyte and no flow-rate limit, RS-485 (Modbus) output, automatic compensation and optional self-cleaning, covering 0–20 mg/L dissolved oxygen and 0–60 °C.
Where a plant integrates several of these probes, a multi-channel analyzer such as the KMPW520 consolidates them: six freely combinable parameters, a 7.0-inch color touch screen, two 4–20 mA channels, six relay outputs, two RS-485 (Modbus-RTU) channels, TF card and USB data storage, historical curves and password protection. The analyzer is the visible layer; the calibration and firmware of each probe underneath it determines whether the displayed number is trustworthy.
Focus: Calibration Evidence for the Digital Ammonia Nitrogen Sensor
Why ammonia nitrogen is a demanding parameter
Ammonia nitrogen measurement in municipal effluent, aquaculture and surface water commonly relies on ion-selective electrode or optical methods. Both are sensitive to temperature, pH, ionic strength and cross-interfering species such as potassium and chloride, and electrode response slope changes as membranes and electrolytes age. In continuous online deployment, biofouling adds a second drift source.
The practical implication is that no factory calibration removes the need for in-situ verification. What factory calibration quality determines is how long a digital ammonia nitrogen sensor holds a usable slope, how predictable its maintenance interval becomes, and whether a replacement probe can be dropped into the same network without re-deriving the whole measurement chain.
What a verifiable calibration record for an ammonia nitrogen sensor contains
- Probe serial number linked to the calibration record
- Calibration method and reference standard identity, with traceability and expiry
- Zero and slope or span values recorded before shipment
- Temperature compensation verification points across the working range
- Acceptance criteria, including stability or soak duration, not just a pass or fail stamp
- Firmware version installed at the time of calibration
- Recommended recalibration interval and consumable replacement schedule for membranes and electrolytes
- Wetted material declaration matched to the target water matrix
- Documented cross-sensitivity information for ions known to interfere in the buyer's process water
Where the lifecycle model shows up in the field
Case evidence from aquaculture illustrates why continuous ammonia and oxygen monitoring is treated as a paired requirement. An aquaculture farm in Norway deployed 15 units for dissolved oxygen and ammonia monitoring over three years, reporting increased fish survival and highlighting saltwater-resistant continuous monitoring (case record 853, related product KWS-630 fluorescence dissolved oxygen sensor). A second Norwegian aquaculture deployment used 40 units for dissolved oxygen monitoring over two years with the same reported outcome of increased fish survival, on the strength of low-maintenance fluorescence dissolved oxygen measurement (case record 165).
The biology explains the pairing: nitrification consumes oxygen and produces nitrate, while ammonia accumulates as a stress factor for stock. A drift that goes unnoticed in either channel changes feeding decisions and mortality risk. The buyer-relevant question after reading such a record is not whether the sensors worked, but whether the units were recalibrated on schedule, whether consumables were available, and whether replacements matched the original calibration.
One boundary should be stated plainly. A case record documents deployment scale, duration and reported outcome; it does not transfer to a different matrix. A buyer applying an ammonia nitrogen sensor to high-chloride industrial effluent or to a municipal stream with fluctuating pH should run a parallel comparison against their reference method before committing the full rollout.
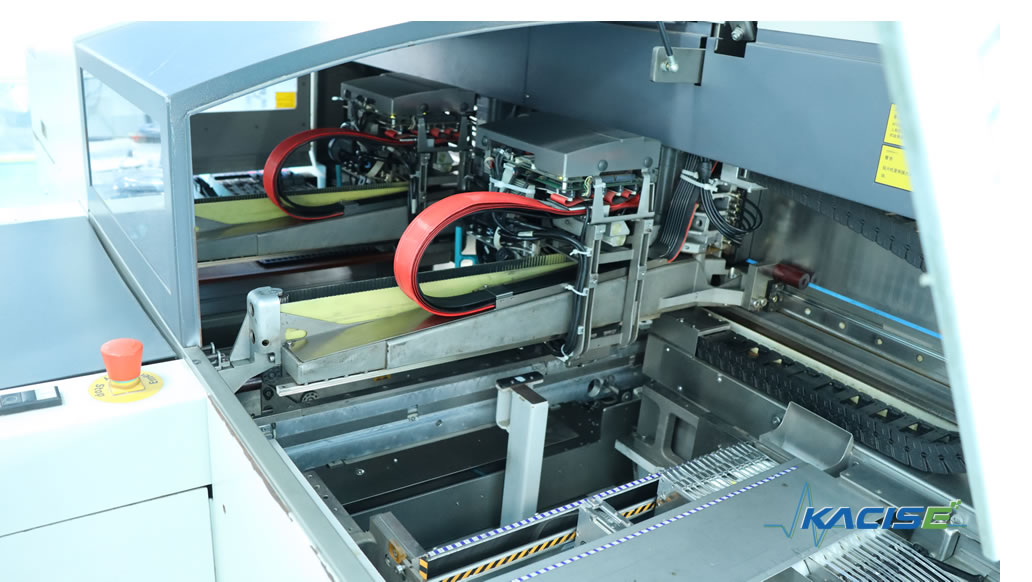
Final validation converts a specification into a deliverable: reference standards, temperature control and a per-unit record are what make a calibration claim auditable.
In-House Calibration Capability as a Quality Proxy
In-house calibration requires reference standards with traceability, controlled temperature, trained operators and a records system that survives years of production. It also implies the ability to recalibrate or rework a returned probe rather than replace it outright. Those requirements are visible in an audit and expensive to fake.
Public evidence from KACISE includes a 100% test quality-control policy across production, and CE EMC certification for water quality sensors under certificate ZTS23061509TCE, issued by Shenzhen ZTS Testing Service Co., Ltd. on 21 June 2023 and covering EN IEC 61326-1:2021, EN 55011:2016+A2:2021, EN IEC 61000-3-2:2019+A1:2021 and EN 61000-3-3:2013+A2:2021. Comparable EMC documentation exists for other KACISE product lines, including certificates ZKT-GXPS400 and ZKT-GXPS353 for pressure transmitters and ZTS23052402XCE for flow meters.
For buyers, those two evidence sets must be read separately. EMC compliance under EN IEC 61326-1:2021 addresses electromagnetic compatibility for measurement and control equipment and matters in plants with variable-frequency drives, pumps and radios nearby. It says nothing about measurement accuracy or calibration traceability. A supplier that can produce both sets is demonstrating a documentation culture; a supplier that produces only one has a partial file.
Scale changes the meaning of that documentation. A facility producing 120,000 units annually and exporting roughly 70% of output cannot rely on individual craftsmanship; it needs a repeatable calibration process, because repetition is what makes a calibration record statistically meaningful rather than anecdotal.
Application Evidence Across Monitoring Scenarios
| Application | Location | Deployment | Duration | Reported outcome | Product reference |
|---|---|---|---|---|---|
| Municipal wastewater effluent quality monitoring | United Kingdom | 12 sensors | 3 years | Compliant discharge, reduced manual sampling, multi-parameter integration | KWS-800, KMPW520 |
| Aquaculture dissolved oxygen and ammonia monitoring | Norway | 15 units | 3 years | Increased fish survival rate; saltwater-resistant continuous monitoring | KWS-630 |
| Aquaculture dissolved oxygen monitoring | Norway | 40 units | 2 years | Increased fish survival rate; low-maintenance fluorescence DO | — |
| Agricultural runoff nutrient tracking | Finland | 4 units | 2 years | Better agricultural pollution control | KWS-450 |
| Wastewater turbidity monitoring | United States | 35 units | 3 years | Three years of stable operation; anti-fouling optical design | — |
| River multi-parameter water quality | Japan | 25 units | 3 years | Continuous environmental reporting; integrated multi-sensor probe | — |
Read as procurement evidence, these records are useful for a specific reason: they describe multi-year deployments in matrices that punish weak calibration — saltwater, agricultural runoff, municipal effluent and river systems. They do not, however, substitute for a buyer's own validation in their own water.
Market Trend Analysis: Where Lifecycle Evidence Is Being Priced In
Three third-party data points frame the direction of the category. The global water quality monitoring systems market reached USD 5.8 billion in 2024, with sensors accounting for the largest segment at a 45% share, according to Grand View Research (via WaterTech). IoT-enabled water quality management is expected to grow at a robust CAGR of 16.23% through 2030, according to TechSci Research. And the sensor market itself is growing at 8.1% annually toward USD 9.10 billion by 2030.
The IoT figure is the one that changes procurement behaviour. When sensors become data nodes inside SCADA, PLC and IoT platforms, integration cost per point falls and the relative weight of calibration quality and support rises. A cheap probe that needs frequent manual verification consumes engineering time that the data pipeline was supposed to save. KACISE products support standard digital outputs such as RS-485 and Modbus and are positioned for compatibility with SCADA, PLC and IoT platforms — a baseline requirement in this transition rather than a differentiator.
Regulation reinforces the same shift. EN IEC 61326-1:2021 defines EMC requirements for measurement and control equipment, and NSF/ANSI 61 and 372 standards govern material safety and lead-free compliance for sensors used in drinking water applications. Each of these creates a document a buyer can request, and each request raises the cost of an unauditable supply chain.
Comparison with Traditional Solutions — and the Limits of the Integrated Model
| Supply model | How it works | What the buyer can verify | Where the model can fall short |
|---|---|---|---|
| Integrated in-house lifecycle | Design, PCB assembly, firmware configuration and calibration performed by the same manufacturer; KACISE operates a 40,000 m² facility with 120,000 units annual output, 100% test, OEM/ODM customization of voltage, logo, output method, protocol and cable, from a minimum order of one unit | Component lot records, board-level test data, firmware control, per-probe calibration certificates | Concentrates dependency on one supplier and requires disciplined spares planning |
| Assembly-and-trade model | Modules or complete probes sourced from third parties; calibration frequently outsourced | Whatever the third party chooses to disclose; traceability must be requested explicitly and may not be reproducible | Calibration traceability and firmware control are outside the supplier's hands |
| Established global instrument brands | Hach (Danaher), Xylem Inc., Thermo Fisher Scientific and Endress+Hauser are identified as established leaders in the water and wastewater sensor market by Mordor Intelligence | Public documentation, installed base and tender familiarity | Commercial terms, configuration flexibility and access to per-probe calibration data should be confirmed case by case rather than assumed |
Boundaries of the integrated model
An honest evaluation has to state where the in-house lifecycle argument stops.
- Certification scope is EMC-led, not application-complete. The water quality sensor certification described in the public record covers CE EMC requirements under EN IEC 61326-1:2021 and related standards. NSF/ANSI 61 and 372 material certifications for drinking water applications are separate requirements and are not part of that certificate set. Buyers in US drinking water projects must confirm material certification independently.
- Calibration is time-bound. Factory calibration does not remove the obligation to verify on site. Ammonia nitrogen and nutrient channels drift in service, and biofouling affects optical and electrode channels differently.
- Lead-time figures differ by configuration. One recorded OEM entry states a 30-day lead time, while another states a shipping time of generally 5–8 working days depending on quantity. Buyers should confirm the schedule per purchase order rather than by catalogue.
- Single-supplier integration concentrates risk. The closer the relationship, the more important it becomes to hold a spares and second-source strategy for critical parameters such as ammonia nitrogen, where a replacement probe must match the original calibration.
- Documentation must be auditable to be useful. If a certificate cannot be tied to an individual probe serial number, the evidence chain breaks regardless of how modern the factory appears.
Buyer's Evidence Checklist for a Sensor Factory Audit
| Evidence item | What it proves | Red flag |
|---|---|---|
| Incoming inspection records for sensing elements, boards and cables | Qualified sourcing and lot control | No lot traceability to finished units |
| AOI and board-level functional test data | Electronics reliability before potting | Only finished-product testing performed |
| Firmware version control list | Configuration control of compensation and protocol | Firmware version unknown per unit |
| Per-probe calibration certificate with serial number and reference standard IDs | Calibration traceability | Batch-level certificate only |
| Temperature compensation verification data | Accuracy under real service conditions | Compensation claimed but not demonstrated |
| Wetted material declaration (for example 316L stainless steel, titanium alloy, POM) | Media compatibility | Materials unspecified for the target water |
| Drift and stability acceptance criteria | Predictability of long-term performance | No documented acceptance criteria |
| Spare consumables and recalibration procedure | Multi-year support capability | Consumables not separately available |
Future Outlook
Digital integration is likely to keep deepening. Multi-parameter platforms such as the KWS-800, which combines up to seven parameters plus temperature in a single IP68 probe with automatic cleaning, reduce the number of penetrations and cables a plant has to maintain — a direction consistent with the 16.23% CAGR projected for IoT-enabled water quality management through 2030.
A second expectation follows from regulation rather than technology: as discharge limits for nitrogen compounds tighten, online ammonia nitrogen measurement moves from a discretionary instrument to a reporting instrument, and reporting instruments attract calibration traceability requirements. Buyers should expect calibration metadata — standard identity, calibration date, drift history — to travel alongside measurement data in monitoring platforms, and suppliers that already generate that metadata will be easier to integrate.
The likely divergence is between manufacturers who can evidence the full chain from board assembly to final calibration and those who compete on unit price alone. For evaluation-stage purchases, where the cost of a wrong sensor is measured in manual sampling hours, compliance risk and replacement logistics rather than in the invoice, the evidence chain is the more durable selection criterion.
FAQ
What factory evidence should a buyer request before approving a water quality sensor manufacturer?
Request incoming inspection records for sensing elements and boards, board-level functional test data, a firmware version control list, per-probe calibration certificates with serial numbers and reference standard identification, wetted material declarations, and documented acceptance criteria including drift or stability limits. Also ask whether calibration and rework are performed in-house or outsourced, because that answer determines whether the supplier controls its own measurement chain.
Why does in-house calibration capability matter more for digital sensors than for analog ones?
In analog systems, signal conditioning and part of the compensation occur in the transmitter, where they can be adjusted or replaced on site. In a digital probe, linearization, compensation coefficients and the communication stack sit inside the probe itself. If calibration is outsourced, the manufacturer may not control the coefficient set that defines the measurement, and may not be able to reproduce it for a replacement probe intended for the same network.
How should a digital ammonia nitrogen sensor be validated before acceptance?
Ask for the factory calibration record tied to the unit serial number, then run a side-by-side comparison against the buyer's own reference method in the actual water matrix. Verify response to a known standard at working temperature, record slope and drift over a defined soak period, and confirm the firmware version, membrane and electrolyte replacement interval, and recalibration schedule. Because ammonia measurement is sensitive to pH, temperature, ionic strength and interfering ions such as potassium, validation in clean water alone is not sufficient evidence of site performance.
What are the limits of full-lifecycle manufacturing claims?
Full-lifecycle claims describe the physical build and calibration path, not certification coverage or guaranteed outcomes. A manufacturer can control PCB assembly, firmware and calibration without holding application-specific approvals: CE EMC certification under EN IEC 61326-1:2021 does not substitute for NSF/ANSI 61 and 372 material certification in US drinking water applications. Factory calibration also does not replace periodic on-site verification, and documented lead times can vary between configurations, so schedule and compliance scope should be confirmed per order.
How can buyers compare a low-MOQ supplier with established global brands?
Apply the same evidence set to every candidate rather than comparing claims. Established global suppliers such as Hach (Danaher), Xylem Inc., Thermo Fisher Scientific and Endress+Hauser appear as leaders in third-party market research, which indicates market presence rather than site-specific fit. Practical comparison dimensions include documented calibration traceability, firmware control, configuration flexibility such as minimum order quantity, output method, protocol and cable options, spare consumables availability, and EMC or material compliance documentation for the destination market.
Which market trends support prioritizing lifecycle evidence over unit price?
The sensor segment represents the largest share of a water quality monitoring systems market valued at USD 5.8 billion in 2024, and IoT-enabled water quality management is projected to grow at a 16.23% CAGR through 2030. As sensors become data nodes inside SCADA and IoT platforms, integration cost per measurement point falls while the cost of unverified calibration rises, because manual verification consumes engineering time. Regulatory documentation requirements, including EMC and drinking water material standards, add a second layer of evidence that an unauditable supply chain cannot easily produce.